

 View your financial assumptions, goals and results of your financial independence analysis
 View your accounts custodied at Fidelity

How Interest Rates Impact Stock Prices
When we discuss our thoughts on companies in the portfolio, we frequently mention the intrinsic value of the underlying business. This is a first principle concept in our investing philosophy, so it is important that it remains at the core of our process. Therefore, we should begin with the mechanics of calculating an investment’s intrinsic value.
In its most simplified form, an asset is worth the sum of the cash flows it is expected to generate, discounted back to the present at a required rate of return. An asset that produces cash flows has tangible value and, thus, a measurable intrinsic value. We consider cash flows to be any form of capital returned to investors, including dividends, interest payments, share repurchases, or a return of principal. Therefore, this framework can be used for stocks, bonds, or any asset that produces cash flows.
Mathematically, this is what that looks like:
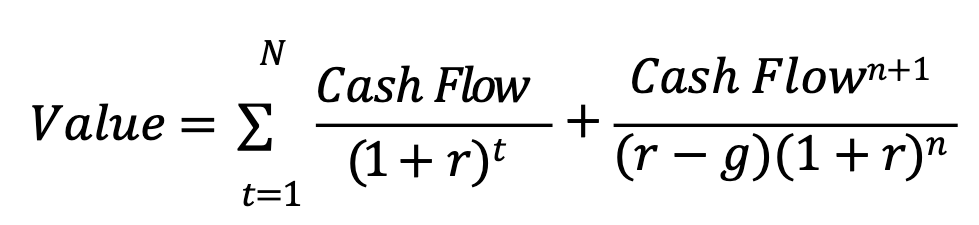
This equation may look daunting, but we can distill this down to four main drivers:
- Cash flows (CF)
- Projected long-term growth rate (g)
- Time horizon (n)
- Discount rate (r)
There are two key details to note here regarding stock and bond valuations. The first is their maturity. Most bonds have a fixed term, while one could theoretically be invested in a stock forever. To make them comparable, we must assume we can sell the stock at some point in the future at a given price, much like a bond’s redemption value. We do this by applying a price multiple to the last cash flow received. We’ll refer to this as the “exit price” hereafter.
The second difference is the predictability and certainty of their cash flows. Many bonds have fixed coupon payments and a fixed redemption amount, meaning investors know the precise timing and amount of each payment. Dividends are much less predictable and not guaranteed. The future sale price (exit price) is even less certain. It depends on a myriad of factors, some of which are outside the business’s control. This makes valuing stocks particularly challenging relative to bonds.
We account for this lack of predictability and certainty in the investment’s discount rate (r). Think of this as the rate you require commensurate with the investment’s riskiness. This rate compensates you for the forgone return in a comparable investment (i.e., opportunity cost). In general, stocks have lower predictability and certainty than bonds, so we demand a higher discount rate. By that same logic, we would also demand a higher return for businesses with a higher degree of uncertainty. This, among other factors, are why stocks usually generate greater returns than bonds, and growth stocks offer greater upside potential than value stocks, all else equal.
This discount rate is the most immediately impacted variable when interest rates change. Therefore, as we move forward in this analysis, it will be the primary focal point. With this framework in mind, we can now examine how interest rates drive the output of this equation and dig into some of the nuances.
The Role of Interest Rates
All else equal, asset values have an inverse relationship to changes in interest rates. As interest rates rise, asset prices generally fall because the cash flows are discounted at a higher rate, making them less valuable today. This is true for any asset class, although the relationship with stocks is a little more complicated.
Some stocks are more sensitive to interest rate changes than others. The level of sensitivity depends on the size and timing of its expected cash flows. Mature companies typically have fewer opportunities to reinvestment profits internally, so they return most of these profits to shareholders in the form of dividends and share repurchases. They tend to grow much slower but are deemed more predictable and often classified as value stocks. On the other hand, younger companies may have more reinvestment opportunities, so they retain their profits to fuel growth – classifying them as growth stocks.
Consider the following example with two hypothetical companies:
ValueCo is generating $5.30 in earnings, returning all of them to investors as dividends and growing 3% per year. GrowthCo is generating $1.00 in earnings today but growing by 30% per year and reinvesting all its profits internally. At the end of the ten-year period, we assume both companies will continue growing by 3%.
Exhibit 1: Hypothetical companies
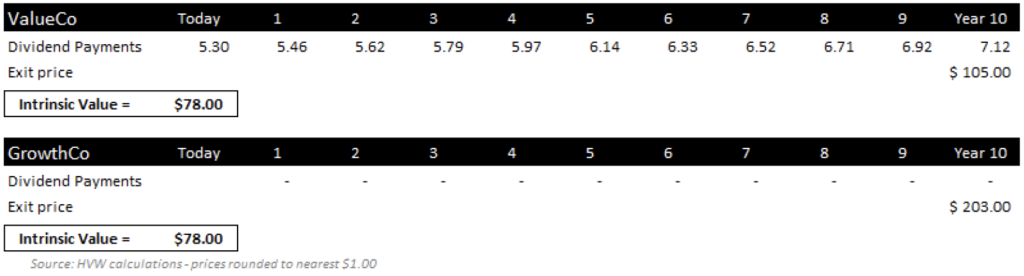
Even though the two streams of cash flows are entirely different, the two companies are worth the same today. This is because of the time value of money. The entirety of GrowthCo’s value is in its exit price. If we expect a 10% return on an investment that can be sold for $203 ten years from now, we would be willing to pay roughly $78 today. The same analysis would lead us to a fair value of only $40 for ValueCo. However, the present value of ten years of dividend payments makes up the $38 difference.
Also, note the difference in the exit price. We assume that you should be able to sell your GrowthCo shares for nearly twice the price of your ValueCo shares at the end of the holding period. Ten years from now, when we assume the two companies will grow at 3%, GrowthCo’s earning power will be significantly higher. GrowthCo will be generating $13.79 compared to $7.12 for ValueCo, making it a much more valuable investment at that point.
When interest rates are steady, these two stocks above are worth roughly the same. But what happens when interest rates change? We quickly see that the timing of each cash flow is just as important as the amount, which leads us to a concept called asset duration.
Asset Duration
Duration is a term usually reserved for analyzing bonds, but conceptually, we can use it for any investment with cash flows by substituting dividend payments for interest payments. You can think of asset duration as the time-weighted receipt of future cash flows. In practice, we can use duration to estimate an asset’s sensitivity to both increases and decreases in interest rates. Essentially, the higher the duration, the greater the impact of a change in interest rates on the asset’s price.
Recall the prior example. All else equal, let’s assume interest rates rise by 1%, theoretically increasing our discount rate from 10 to 11%, which should cause ValueCo’s price to drop by roughly 13% versus 21% for GrowthCo (see Exhibit 2).
Exhibit 2: Expected price change with a 1% change in interest rates
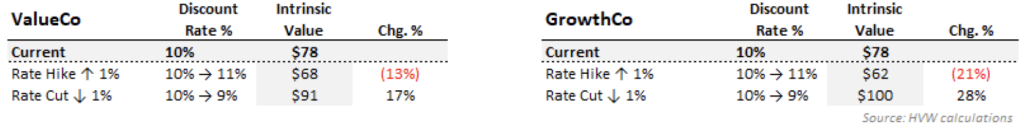
Growth companies are higher-duration assets and, thus, more sensitive to changes in interest rates. Note that this works both ways. If rates were to fall by 1%, GrowthCo would be worth 28% more compared to only a 17% increase in ValueCo.
Why the difference? ValueCo returns capital by paying an annual dividend, so you earn a tangible return on your investment much sooner. Also, you are given a chance to reinvest these cash flows at the new interest rate, making ValueCo less sensitive to interest rate changes.
With growth companies, most of the value is built into the exit price, making returns more backloaded. For example, GrowthCo investors only realize a tangible return by selling their shares, making the exit price a key driver of present value.
A good comparison would be purchasing a coupon-paying bond and a zero-coupon bond. A coupon-paying bond can be purchased at its par value (redemption value) and still generate returns through coupon payments. As its name implies, the zero-coupon bond does not pay anything while you own the bond, so it must be purchased below its par value. In this scenario, the zero-coupon bond has a higher duration since its returns are backloaded, meaning a change in interest rates would have a greater impact on its current price.
Price Sensitivity
When interest rates change, the variable most impacted in the equation is the discount rate. The impact is twofold. First, this rate is present throughout the equation in its discounting mechanism. Second, it is a key component of the exit price. Therefore, the asset’s value is especially sensitive to even minor fluctuations in this rate.
Let’s dig deeper into the exit price. Recall the value equation and the function “(r – g)” towards the end of the formula. This is the spread between the discount rate and a presumed long-term, perpetual growth rate. The spread also represents the required cash flow yield. Consider the following example:
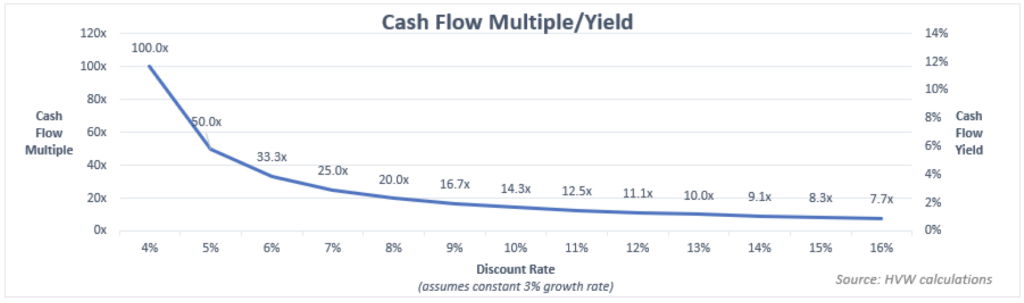
Suppose you expect a company to generate $7 in earnings and pay them to you as a dividend. You believe earnings will grow 3% per year and want to earn 10% per year on your investment. To reach your 10% hurdle rate, the investment must yield 7%, meaning you would be willing to pay no more than $100 for its shares. In practice, we can take the reciprocal of this cash flow yield 1/(r-g) and turn it into a price multiple – i.e., 14.3 times cash flow.
The lower the spread between these two, the higher the price multiple. The spread can be condensed in two ways.
- Lower discount rate – The market will price stocks at a premium when interest rates fall, assuming no change in growth. This is because the opportunity cost of investing in relatively safer asset classes like bonds is lower, making stocks relatively more attractive from a risk-reward perspective.
- Higher growth rate – The market places a premium on growth stocks because of the prospect of higher future cash flows. Investors are willing to accept a lower yield today (receive fewer interim cash flow distributions) and allow the company to reinvest its profits for growth.
Exhibit 3 below shows the applicable price multiples when rates move in 1% increments. Note that this assumes 3% growth and no other changes to the equation.
Asset Convexity
You can see the equation’s sensitivity when interest rates move. Recall the $100 stock example above. If rates rise by 1%, we now need an 11% return to justify investing in the stock. Assuming we still think it will grow 3% annually, we now require an 8% yield. So, for the company generating $7 in earnings (and dividend payments), we must now apply a 12.5x multiple. We would now be willing to pay no more than $87.50 for its shares. If the market is efficient, it should reprice the stock to reflect this value, resulting in a 12.5% unrealized loss.
You may also notice that the sensitivity intensifies when rates start from a lower base. This second-order effect transforms it into a non-linear relationship. We can think of this as asset convexity – another term more commonly used with bonds.
Continuing the example above, if we assume that rates are 6% and rise to 7%, all else equal, the same stock will fall in price from $233 to $175, or a 25% unrealized loss – double our loss when rates started at 10%. This is simply the law of logistic growth in action and explains why asset values are more volatile in low-interest-rate environments.
Caveats to this framework
We mentioned that the relationship between interest rates and stocks is complicated. There is extra nuance to consider that tends to cloud the interplay between the two.
Thus far, we have assumed isolated changes in the valuation formula. We also need to consider a company’s profits (or cash flows) in conjunction with a changing interest rate environment. Interest rates generally fall when the economy is weaker and needs stimulus or when aggregate profits are depressed. Conversely, rising rates often coincide with strong economies when profits are much higher. This is because the market cycle generally precedes the economic cycle. We often see this during end-of-cycle periods when asset price growth (via price multiples) begins to decelerate before any slowdown in their underlying fundamentals. The market is forward-looking and hesitant to apply peak multiples to peak earnings. The same applies to cycle bottoms and trough earnings. This counterbalances the natural relationship between rates and stock prices, where the lag period effectively dilutes the structurally required price change.
Also, low-interest rates entice businesses to increase their leverage with cheaper and more accessible capital. Two things happen here. Growth rates will accelerate if management invests this new capital into high-return ventures. However, the added debt burden and higher risk of financial distress will make investors demand a higher discount rate, offsetting some of the faster growth rates. Management’s capital allocation decisions will dictate whether this is a net positive or negative catalyst for intrinsic value.
Takeaways and Strategic Implications
In a vacuum, we can draw a few high-level conclusions from our analysis.
- High-duration assets are more sensitive to interest rate changes
- Asset prices are more sensitive to rate changes when rates are already low
- High-duration growth stocks should outperform when rates are low or declining, and especially when both are occurring. They should underperform when the opposite occurs (high and/or increasing rates).
Having a firm grasp of these conclusions keeps us grounded in turbulent markets and enables us to act more quickly and with greater conviction. We like to take this one step further and exploit an incidental inefficiency that we call Misjudgment of Equity Duration. A simplified example of this inefficiency is when the market’s estimate of a company’s cash flow duration is too high, rates rise, and the ensuing price drop is overdone, thus creating a buying opportunity. We are always looking for sources of potential value dislocation and price inefficiencies and believe this is one of the more actionable ones because:
- Equity durations are hard to estimate. As we discussed above, coupon payments and redemption values are known with bonds, so duration is easier to measure. With stocks, capital returns to equity holders are less certain and projectable, making duration an estimate rather than a calculation. This is why we focus so much of our research on fundamental analysis. We believe developing that deep understanding of the underlying business helps us estimate the true duration of a company’s cash flows and, thus, the ability to identify misjudgments.
- Misunderstood stocks are classified and traded indiscriminately. The market often makes mass generalizations and trades similar companies together – disregarding the nuances and quality of each company’s cash flows and growth. This is especially common in growth stocks due to the high duration nature of their cash flows and the difficulty forecasting them.
- Value dislocations and price inefficiencies can be especially wide. As we illustrated earlier with our description of asset convexity, very small changes in rates (especially when they are low) can cause extreme price volatility.
High-quality companies commonly sell off for two reasons: changes in (1) company-specific fundamentals or (2) exogenous variables like interest rates. Misjudgment of Equity Duration occurs at the intersection of the two. At this intersection, inefficiencies tend to emerge due to the tug-of-war between top-down and bottom-up investment frameworks. In our experience, inefficiencies create volatility – and where there is volatility, there is opportunity.
To read the whitepaper click here

Matthew Holman, CFA
Sr Equity Analyst/Asst Portfolio Manager

Louis Foxwell, CFA
Sr Equity Analyst/Asst Portfolio Manager
The foregoing content reflects the opinions of Hunt Valley Wealth and is subject to change at any time without notice. Content provided herein is for informational purposes only and should not be used or construed as investment advice or a recommendation regarding the purchase or sale of any security. There is no guarantee that the statements, opinions or forecasts provided herein will prove to be correct. Past performance is not a guarantee of future results. All investing involves risk, including the potential for loss of principal. There is no guarantee that any investment plan or strategy will be successful. Hunt Valley Wealth is a d/b/a of, and investment advisory services are offered through, Connectus Wealth, LLC, an investment adviser registered with the United States Securities and Exchange Commission (SEC). Registration with the SEC or any state securities authority does not imply a certain level of skill or training. More information about Connectus can be found at www.connectuswealth.com.